We installed the flow analyzers on GitHub, one after another
This post measures one thing: how far a network admin has to go from download to a first chart whose numbers they trust. traffic66 has the shortest path. On security detection it is level with ntopng. On scale, deep packet inspection and community, others are ahead. Every claim is checked against the other projects' own documentation, with links at the end.
The field
We took the projects on GitHub for sFlow, NetFlow and IPFIX with the most stars. Some are complete products, some are only collectors, some are archived. Star counts are those shown on GitHub.
| Project | Stars | What it is | What you install first | Status · licence |
|---|---|---|---|---|
| ntopng | 8.1k | Web traffic monitor with nDPI deep packet inspection | Redis; for NetFlow/sFlow, nProbe, which needs a licence | active GPL-3.0 |
| FastNetMon | 3.7k | DDoS detection, can trigger BGP blackholing | Linux; charts through InfluxDB/Grafana or similar | active GPL-2.0 |
| ElastiFlow (legacy) | 2.5k | Logstash pipeline and Kibana dashboards | Elasticsearch, Logstash, Kibana | archived 2024-03 |
| Akvorado | 2.3k | Collector, enricher and visualizer | inlet, Kafka, outlet, ClickHouse; Redis in the official compose | active AGPL-3.0 |
| pmacct | 1.2k | Collector daemons with BGP and BMP | A database and dashboards of your choice (often Grafana) | active GPL (moving to BSD-style) |
| vflow | 1.2k | Collector feeding Kafka | Kafka plus storage and dashboards downstream | Apache-2.0 |
| nfdump | 922 | Command-line collection and query tools | No web UI of its own | active BSD |
| Cloudflare goflow | 919 | The collector Cloudflare used internally | Kafka plus downstream | archived 2025-02 |
| GoFlow2 | 798 | High-performance collector | Output to Kafka or files; storage and UI are yours to build | active BSD-3 |
| traffic66 | new | Collector, storage, web and terminal UI, detection, pcap analysis | Nothing: one executable with embedded DuckDB | active source-available (see below) |
The current ElastiFlow is now called NetObserv Flow. It is closed source; its free Community tier is limited to 500 flow records per second.
1. From download to the first chart
This is the part we care about most. When someone asks at 3 p.m. who is filling the uplink, nobody wants to learn Kafka first. These are the shortest paths in each project's documentation:
A new traffic66 installation signs in as admin / traffic66 and asks for a password of your own at the first sign-in. On Windows, double-clicking traffic66.exe opens the browser. To look around first, traffic66 demo builds a simulated company network with a day of history and a complete attack.
About Windows: almost everything in the table runs on Linux or Docker only. traffic66 builds native Windows, Linux and macOS programs from the same code, with no WSL and no Docker. In many small organizations the monitoring machine is a Windows PC.
2. Do the numbers match the interface counters?
The question every flow tool gets: the chart says the uplink carries 800 Mb/s, SNMP in Zabbix says 600. Which one is right?
Flow numbers are estimates: sampled packets times the sampling rate. traffic66 has a page for exactly this, Interface check. It draws each interface's flow estimate and the device's own counters (sFlow counters or SNMP) in one chart, and computes the difference and the statistical error of sampling. When the difference is larger than sampling explains, it names the likely cause: interfaces not sampled, the same traffic sampled on two interfaces, export packets lost on the way, or a sampling rate not yet received.
Behind it are a few quiet details: the sampling rate the device actually applied; records held until their sampling rate arrives instead of being counted 1:1; compensation for lost export packets; long flows spread over the minutes they lasted; and Ethernet overhead added to NetFlow byte counts, because interface counters include it.
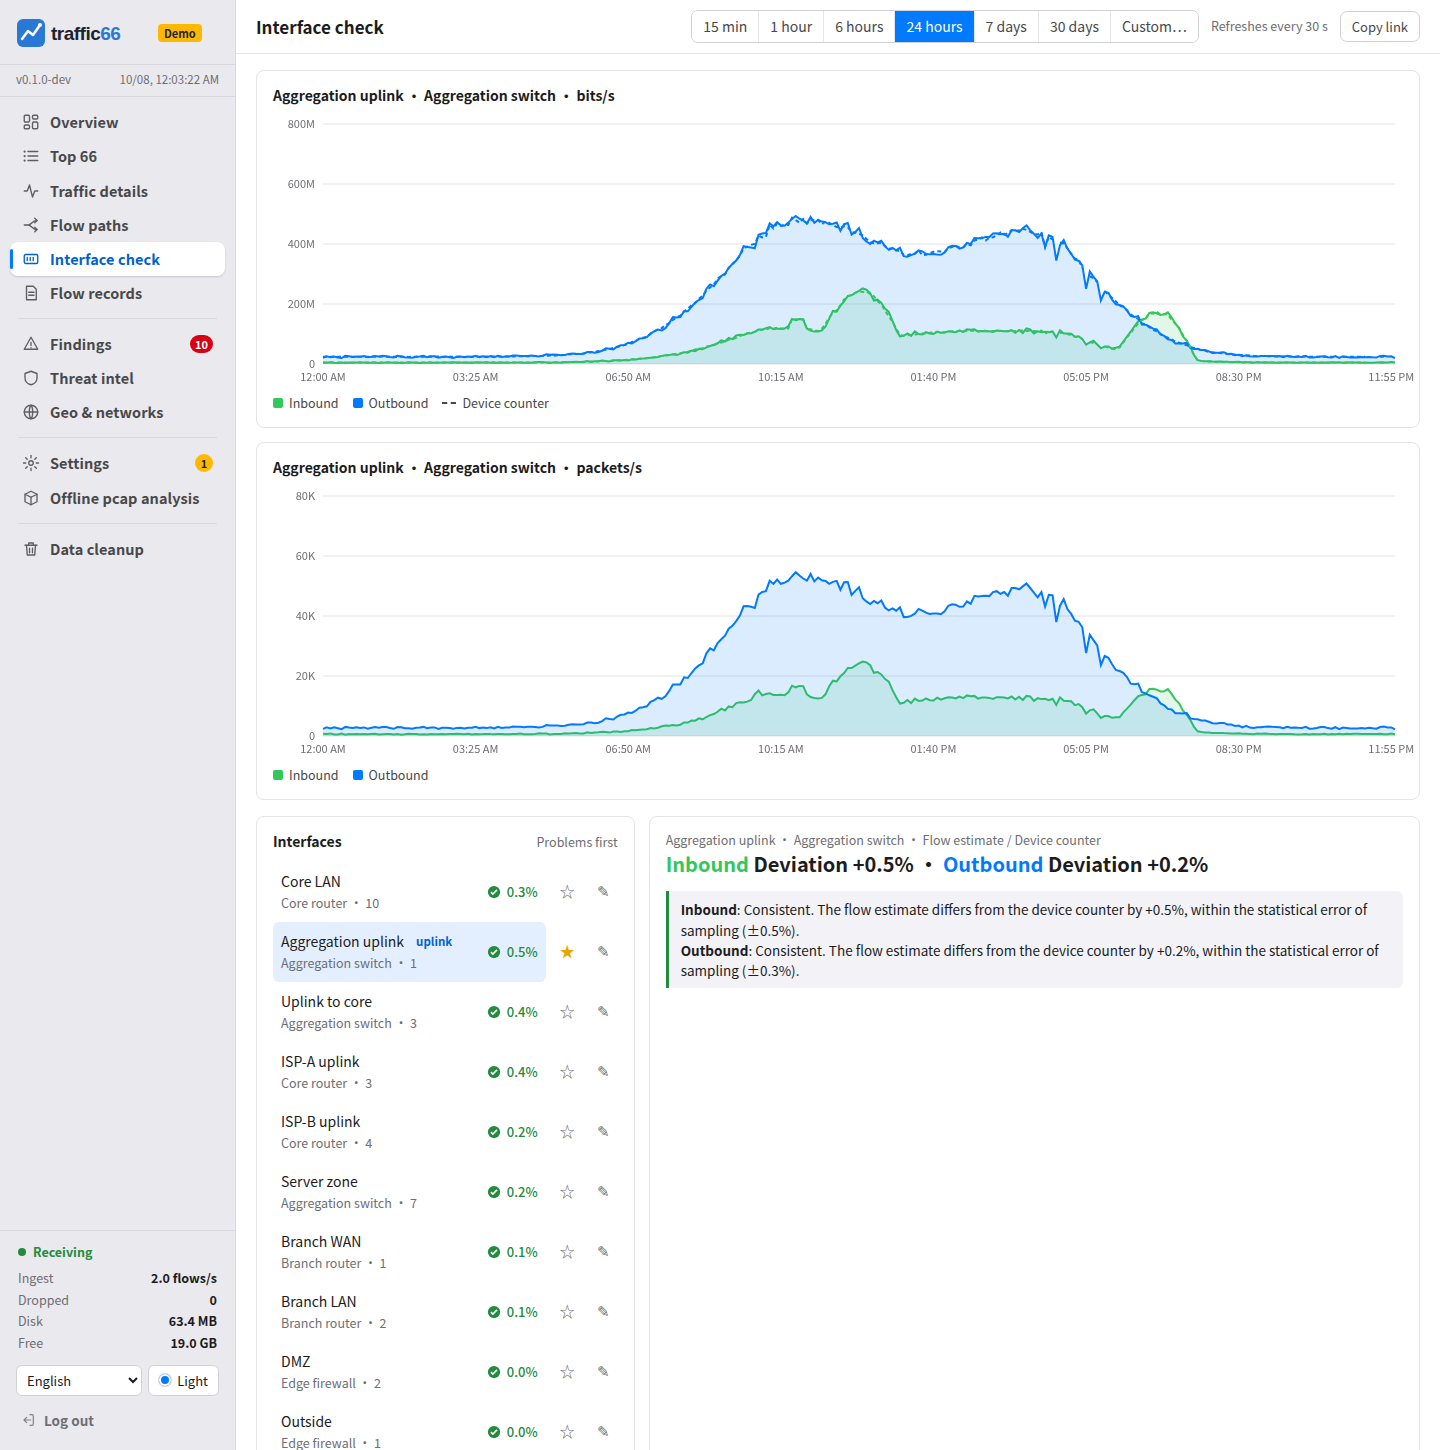
How far the others go:
snmp line.Elsewhere, interface counters are either not read or shown as one more chart to compare by eye. We did not find another project that states why the numbers differ.
3. A conclusion on opening, no query language
The overview answers how much traffic there is now, who uses it, and how that compares with yesterday. Every address, port, application and country can be clicked: show only this, exclude it, open its flow records, open its details page. The interface is designed so that you rarely need to type.
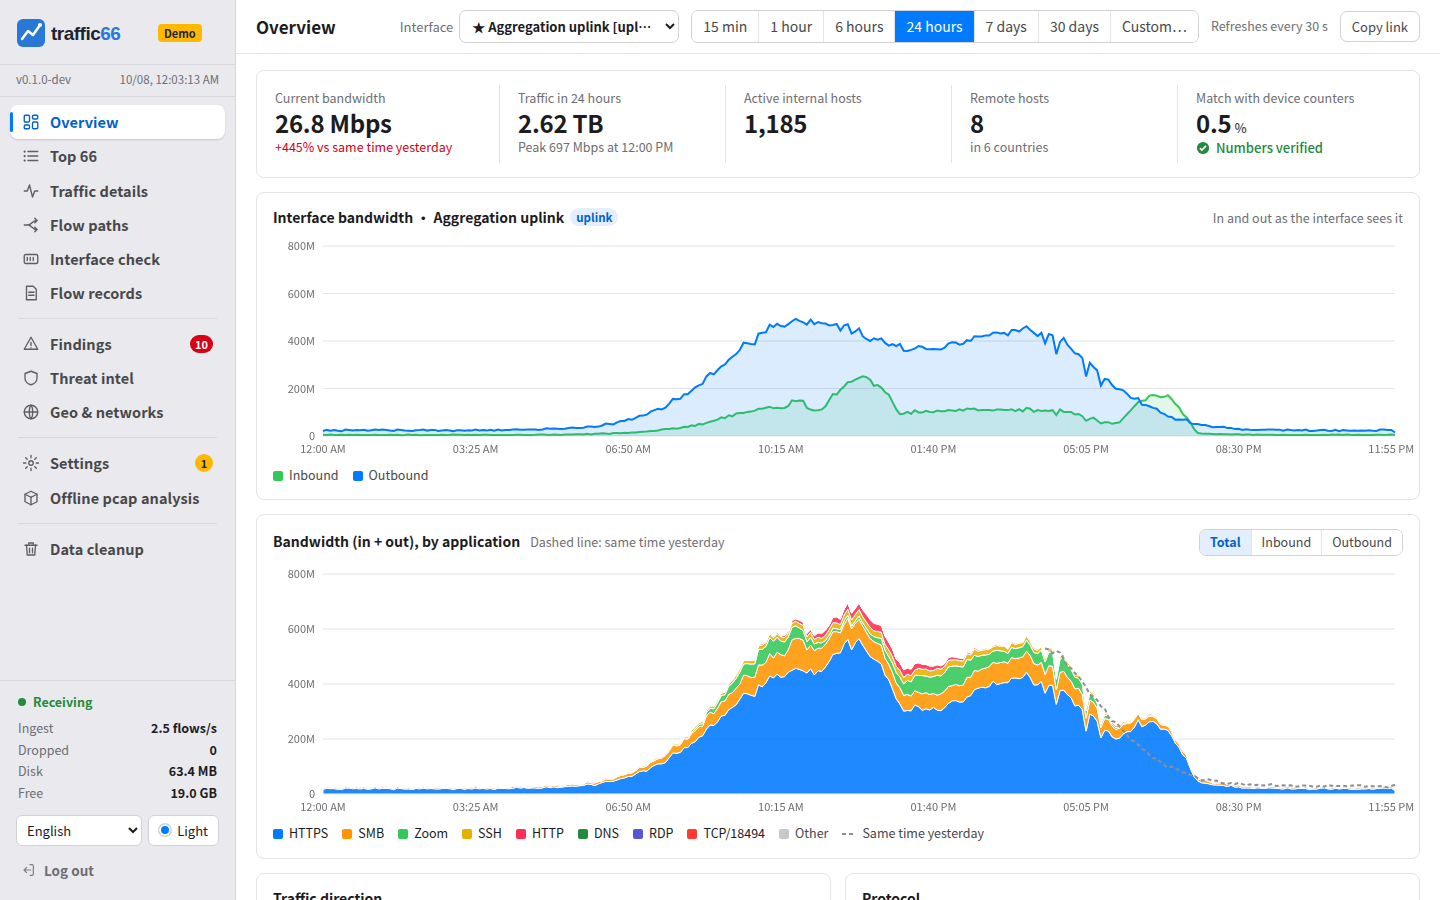
The same job in the other projects:
4. Finding attacks in sampled data
Detection on sampled data is hard: at 1:4096, a scan may leave a handful of packets. traffic66's rules are calibrated for sampled data. In the demo, the whole attack chain is found through 1:4096 sFlow: internal scan, port scan, password guessing, lateral movement, a large upload to a new address, and threat list traffic. A day of the demo's normal traffic produces no other findings, apart from the internet scanner knocking on the website.
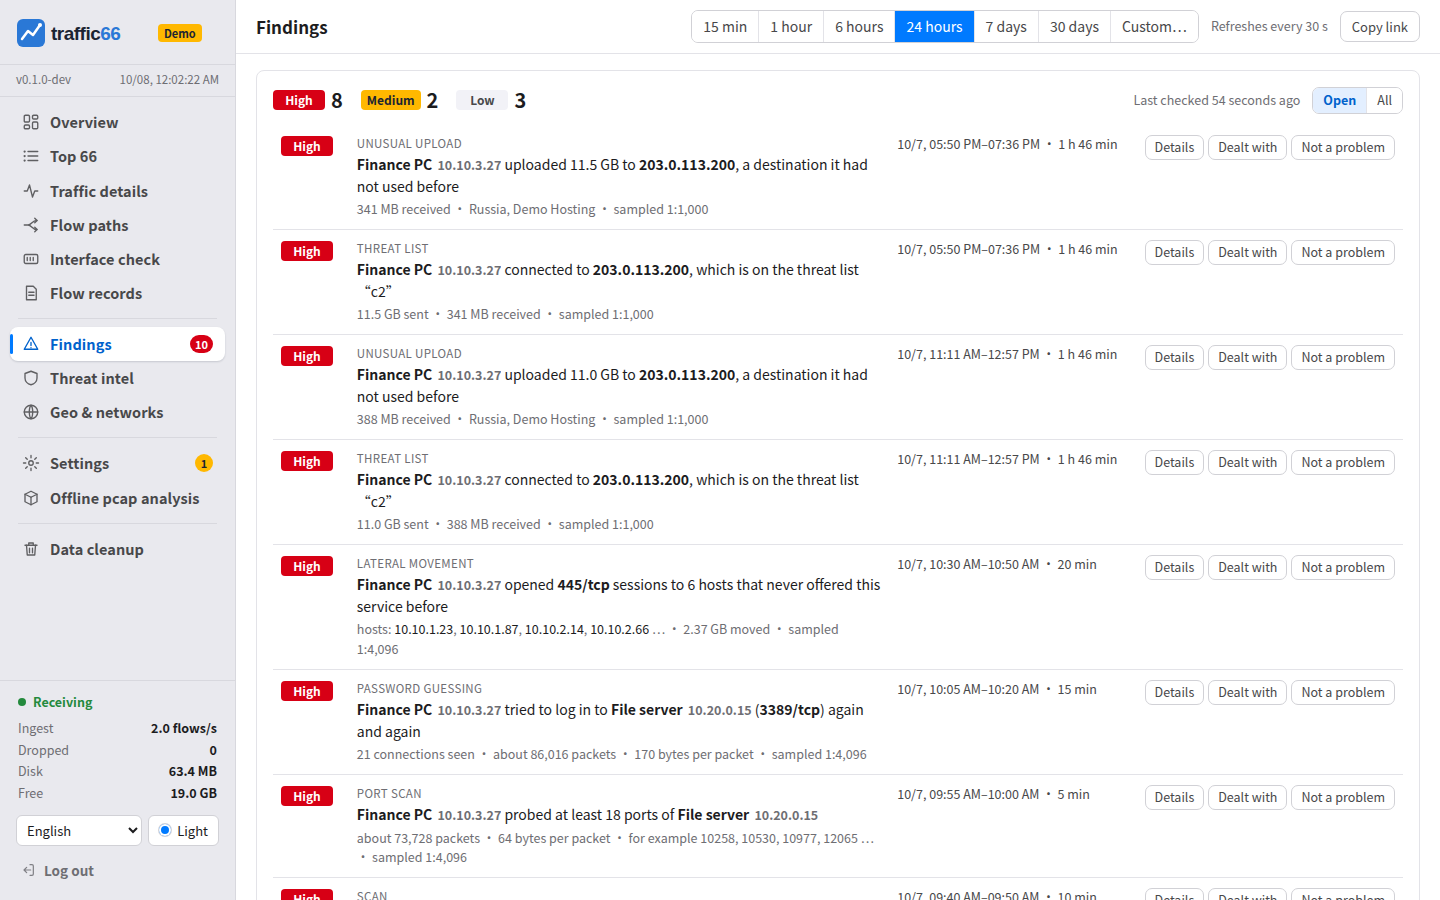
Here the comparison is closer:
On security we are level with ntopng. What we offer is that the checks come in one program without setup, and are tuned for sampled data.
One more convenience: traffic66 capture.pcap analyses a packet capture with the same pages, kept apart from the live data. ntopng reads pcap files too, so call this one even.
Scorecard
The points above and the weaknesses below in one table. Filled means done, half means partly, paid or a separate install, empty means not there.
| Capability | traffic66 | ntopng | Akvorado | ElastiFlow (current) | FastNetMon | CollectorsGoFlow2 · pmacct · vflow · nfdump |
|---|---|---|---|---|---|---|
| One program, ready after install | Redis + nProbe licence | Kafka + ClickHouse | Elasticsearch + Kibana | Grafana for charts | build storage and UI | |
| Runs natively on Windows | Windows build is a demo | |||||
| Built-in web UI | Kibana dashboards | commercial edition | ||||
| UI in many languages | 13 | 7 | English | Kibana only | ||
| Flows checked against interface counters | SNMP charts (Enterprise) | build it yourself | ||||
| Security detection | most checks | threat enrichment | DDoS only, with mitigation | |||
| Offline pcap analysis | ||||||
| Terminal UI | console client | nfdump CLI | ||||
| Layer-7 application recognition | nDPI | |||||
| Horizontal scale-out | 5,000 records/s, one machine | paid tiers | ||||
| OSI open-source licence | source-available | closed |
traffic66 fills the first eight rows; no other column does. The last three rows are our weak points.
Where others do better
Read this section before you choose.
Scale
traffic66 is designed for 5,000 flow records per second on one machine with embedded DuckDB. For carrier-scale traffic, a Kafka and ClickHouse architecture that scales out is the right answer.
Deep packet inspection
ntopng has nDPI and recognizes hundreds of layer-7 protocols. traffic66 works on flows; applications are known by port, packets are not parsed.
Automatic DDoS mitigation
FastNetMon can announce a BGP blackhole or FlowSpec rule as soon as it detects an attack. traffic66 reports floods and leaves routing alone.
Routing data and flexibility
pmacct takes BGP and BMP alongside flows, adds routing information to records and writes to almost anything. traffic66 is a finished product, not a toolkit.
Age and community
ntopng has close to 30,000 commits; nfdump has been around for two decades. traffic66 has only started collecting stars and has far less production mileage.
Licence
They use OSI-approved open-source licences. traffic66 is source-available: free for evaluation and for organizations under 100 people; larger organizations register after 30 days. Nothing is switched off, but it is not open source.
Which one to pick
What we are confident about is three things: quick to install, easy to read, and numbers that match. For the rest, issues on GitHub are welcome; we will close the gaps one by one.