Flow analytics in a single program
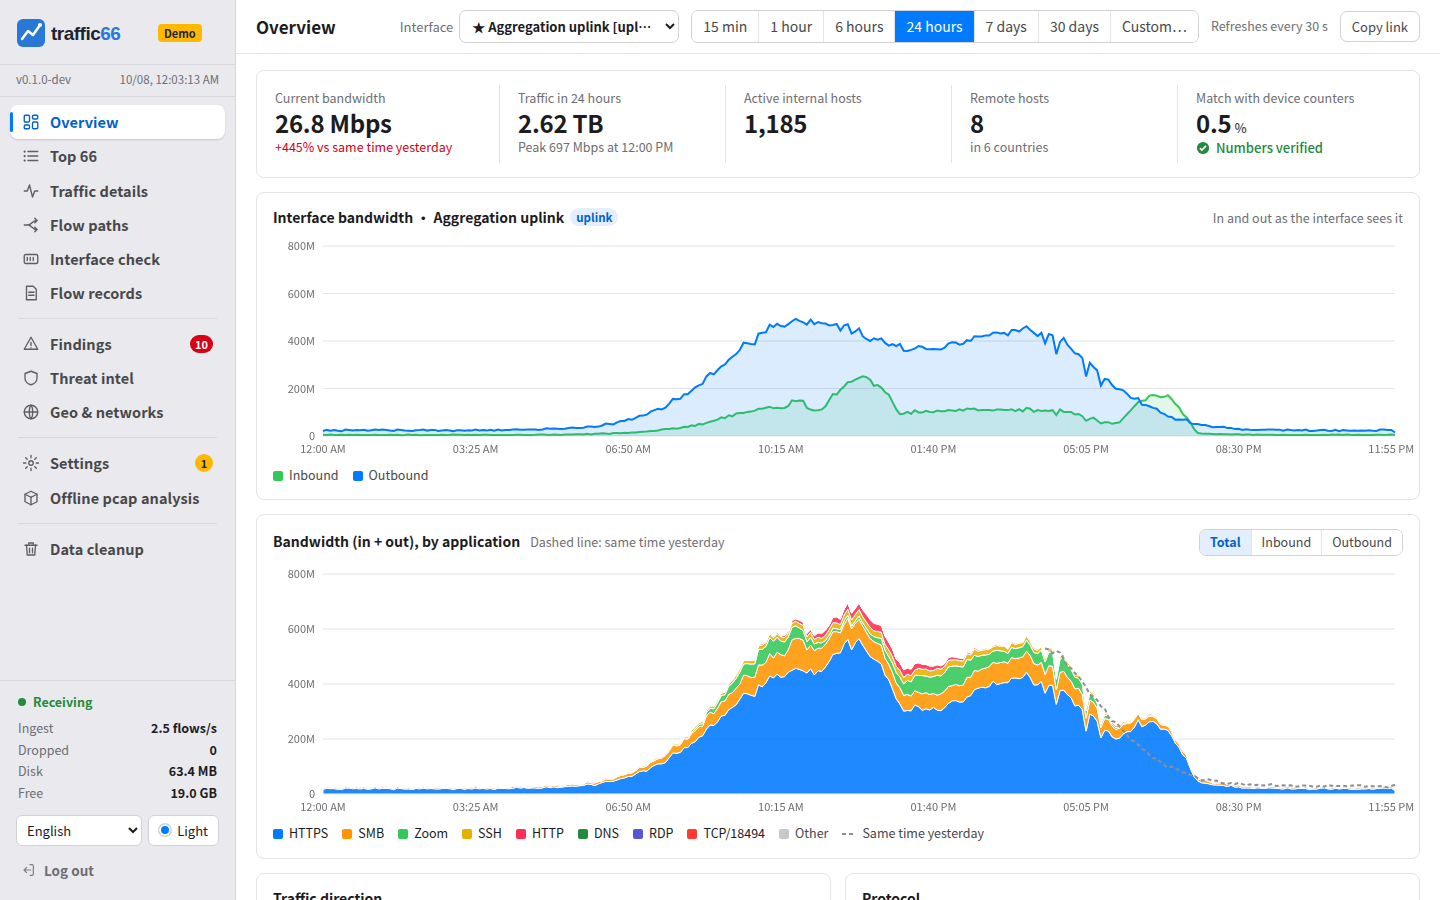
traffic66 collects flow exports from switches, routers and firewalls, and shows who uses the bandwidth, where the traffic goes, and whether the numbers match the devices' own interface counters. One executable, no database to install, works offline.
What it does
Collect
sFlow v5, NetFlow v5 and v9, IPFIX on any UDP port, or local capture from a network card or mirror port.
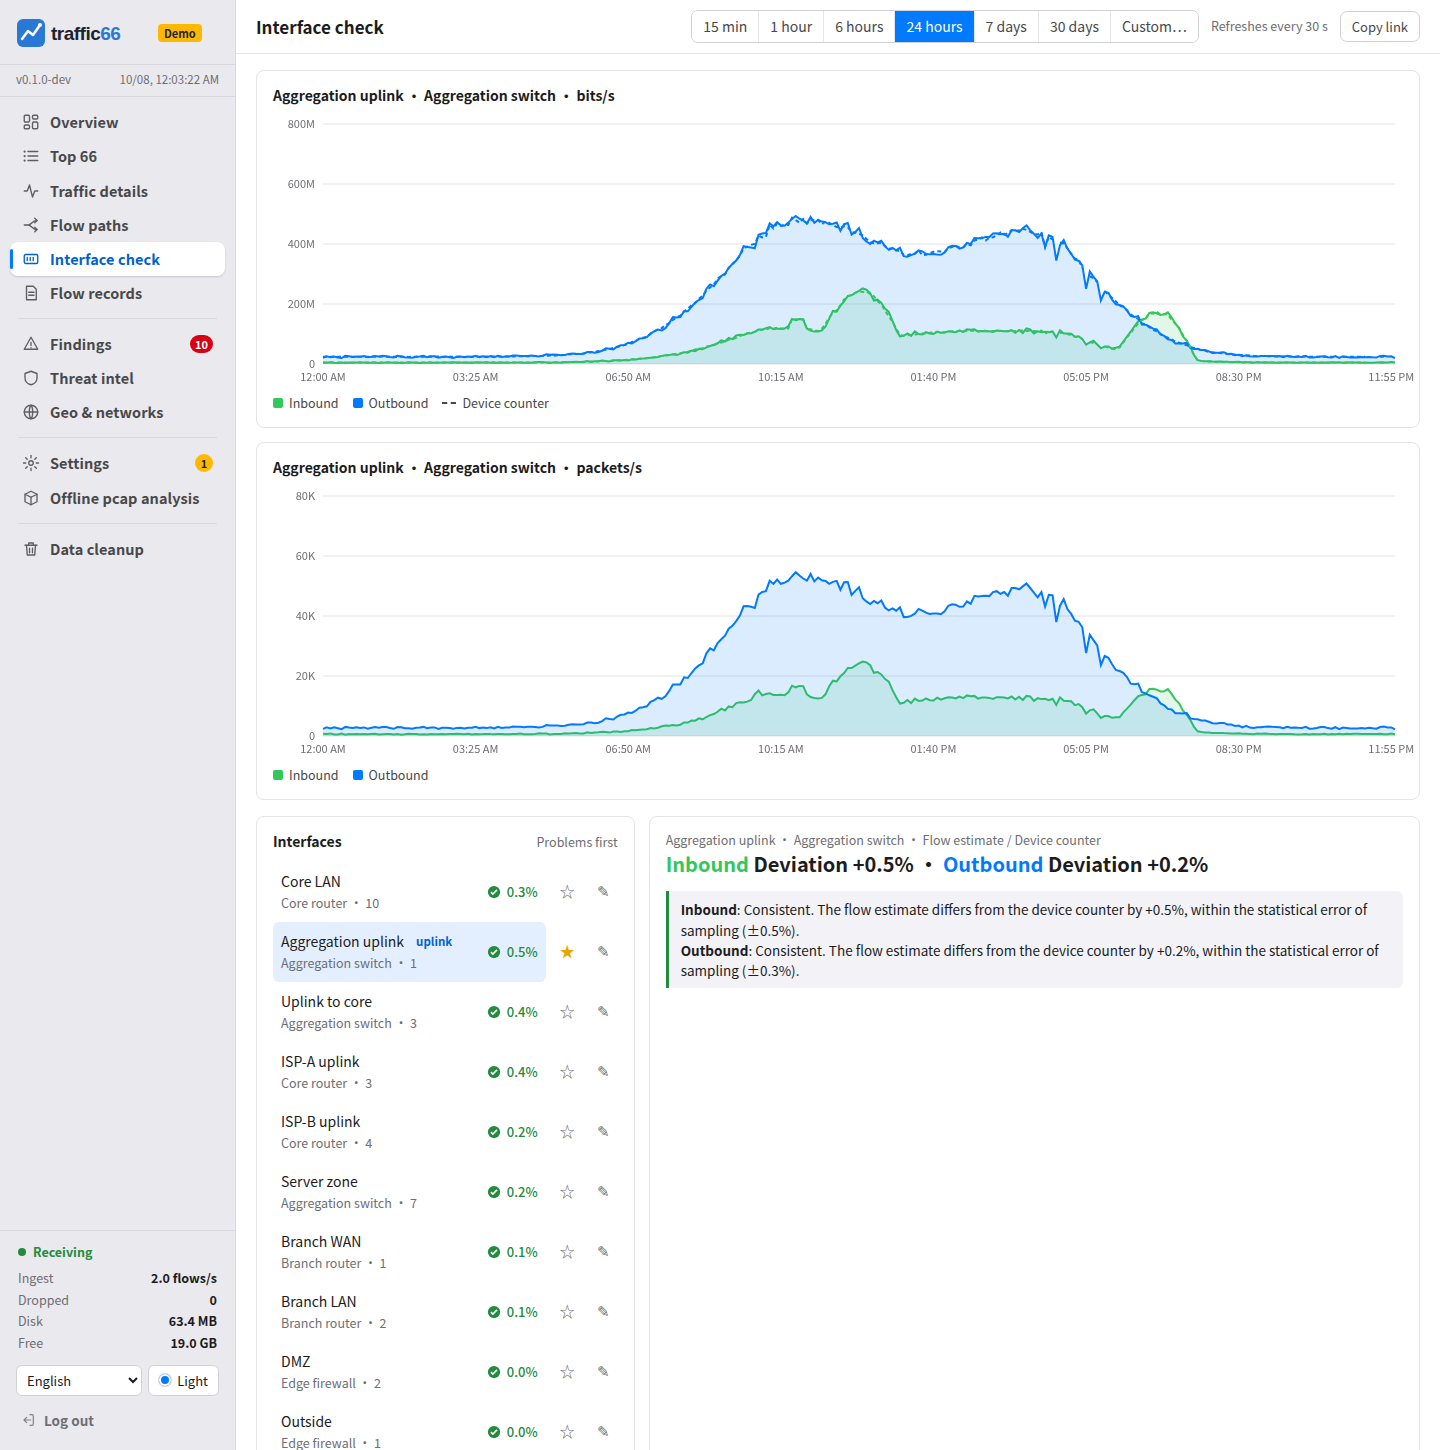
Check the numbers
Flow estimates next to the interface counters (sFlow or SNMP), with the likely cause when they differ.
See who and where
Top 66 conversations, ring charts of clients and servers, flow paths, countries and networks on a world map.
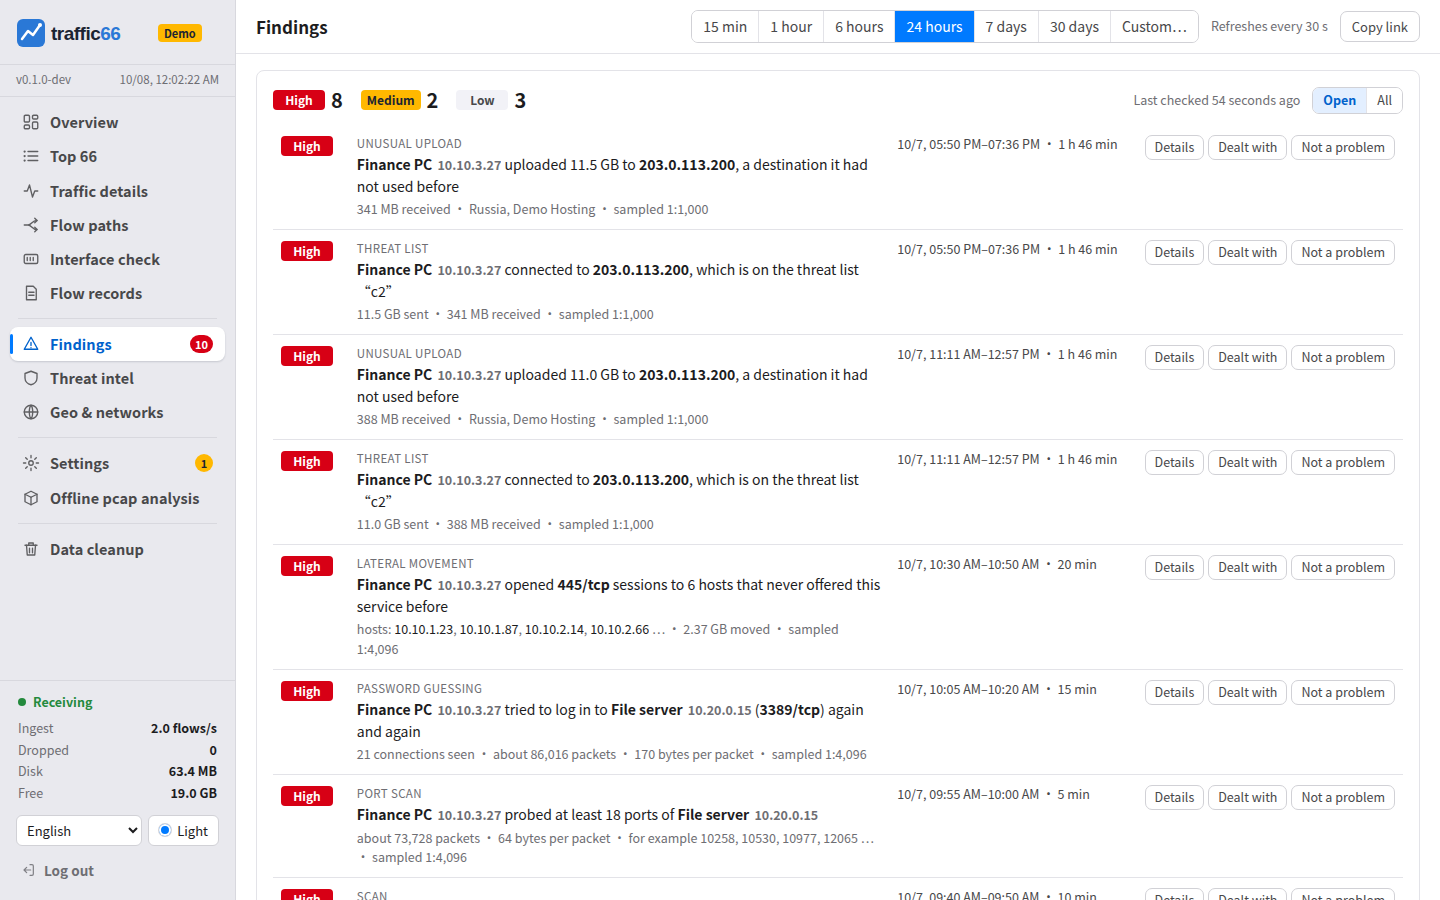
Find attacks
Scans, password guessing, lateral movement, unusual uploads, floods and threat lists, also through sampling.
Analyse captures
traffic66 capture.pcap opens a packet capture with the same pages, kept apart from the live data.
Read it your way
Web UI and terminal UI in 13 languages, five colour themes, links that open exactly the same view.
Latest from the blog
- 我们把 GitHub 上的流量分析工具都装了一遍ZH
ntopng、Akvorado、ElastiFlow、FastNetMon、pmacct、GoFlow2、nfdump 和 traffic66 逐项对比:安装路径、计数器对账、界面、安全检测,以及别人做得更好的地方。
- We installed the flow analyzers on GitHub, one after anotherEN
ntopng, Akvorado, ElastiFlow, FastNetMon, pmacct, GoFlow2 and nfdump next to traffic66: install path, counter check, UI, detection, and where others do better.
Licence
Source available under the PolyForm Noncommercial License 1.0.0 with the Traffic66 Additional Use Grant: free for evaluation and for organizations under 100 people; larger organizations register after 30 days of production use. Nothing is ever switched off. Read the terms.